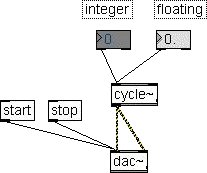
Now let's see another way to control the
cycle~
frequency. Get two number box, one integer and the other
floating from
the palette and put on the patcher window. Connect with a cycle~
and
connect the cycle~ with a dac~.
Note that I don't write a frequency value on the cycle~. This
means
that the cycle~ will start using its default frequency that is
0, i.e.
don't play until a valid frequency value is received from the
controls.
Add the usual start and stop messages to the dac~ as in figure
and go
to play mode.
In play mode, click on the integer number box and drag the mouse
on
high. You'll see the value in the box rapidly changing. When the
number
will reach an audible frequency (e.g. 20-30, but could be more,
depending on the quality of your speakers; remember that the
little
computer speakers often don't work at all under 100 Hz), you
will begin
to hear a glissato moving from low to high frequencies.
Now, you see, the number box don't act as button, like messages.
It
works as a slider that you can control dragging the mouse up and
down.
Now try the floating point number. This one works as the former,
but a
little difference: if you click on the left part of the box
(near the
little triangle) only the integer part of the number change; if
you
click on the right, the fractional part also change. So clicking
on the
left you have a coarse control and clicking on the left you get
a more
fine control.
You can also change the box dimension to be sure to see all the
number:
in edit mode, move the mouse near the lower right corner of the
box
until the cursor become a cross, then click and drag.
Now,
it is very
important
that you are always aware of the
patch data flow.
You must be able to figure in your mind how and when
the data flow in a Max/MSP patch.
It could be a little difficult for beginners, but only by this
way you
can understand
the more complex patches.
So let's stop just a moment to understand exactly what's
happening in
this
simple patch.
- When the number changes (and only when the number
changes)
a message start from the number box, runs through the wire
and reach
the cycle~. This number is not a frequency, it's a
pure number.
Its only meaning are its value and its format (integer or
float).
- The cycle~ receive this number in its left inlet and uses
it
as a
frequency value only because on the left inlet a frequency
value is
expected. If you connect the number box to the
cycle~'s right
inlet,
you'll hear no frequency change because on the right inlet a
phase
value (not frequency) is expected.
- So it's the cycle~ that gives the number a meaning,
depending on the inlet the number reach. Note that the
cycle~ don't
mind about the number format because a frequency can be
written both
way (with or without fractional part), but, with other
objects, the
right format also is requested by some inlet. On the
computer, the
number 50 is different from the number 50.0 so the right
number with
the wrong format could be seen as an error.
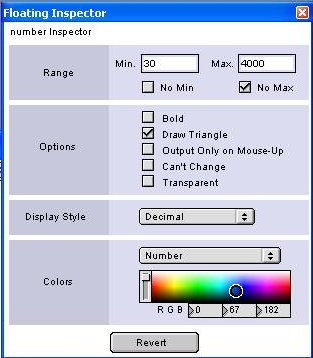 The Floating Inspector
As you see, while dragging on a number box, you can go up and
down with
no limits. You can also output negative numbers. Of course,
setting
minimum and maximum to some meaningful value should be better.
To do so, go to edit mode, select the number object and click
the menu
Windows → Show Floating Inspector.
This dialog allows you to set many options for the current
selected
object. Note that the floating inspector options are not the
same for
all objects, because any object has its own distinctive
features. Some
objects have no floating inspector at all.
For number box, integer or floating, the most important feature
is the
range. Here you can set minimum and maximum values.
Now we are using this number to control a frequency, so set the
range
to reasonable values in Hertz e.g. min 20-30, max 4000-5000 (the
lower
note on the piano is 27.5 Hz, the higher is 4186 Hz). Be sure
the “No
Min” and “No Max” check boxes are unchecked. Now you can freely
drag
the mouse.
By the floating inspector you can also set the colors of the
number
object, the display format and a bunch of options:
- Bold: display the value in bold
- Draw Triangle: display/hide the little triangle on the
left of
the number box
- Output Only on Mouse-Up: this is an important option (try
it). If
you check it, you'll hear no glissato while changing the
value with the
mouse. The value will change only when you leave the mouse
button. It
means that, while playing, you can change a number with no
acoustical
effect until you reach the right value.
- Can't Change: make the number box read only. Useful when
it is
used only to show a number (r.g. the result of a
computation)
- Transparent: hide the box displaying the number only.
Amplitude Control
The cycle~ has no amplitude control in itself. It always output
the
wave at the maximum amplitude value.
To control the sound amplitude we must insert an amplifier
between the
signal generator (the cycle~ in our example) and the dac~.
To understand how an amplifier works on a digital signal,
remember that
a digital sound wave is a stream of number running at SR speed
(e.g.
44100 numbers per second). Each number is an amplitude sample
of
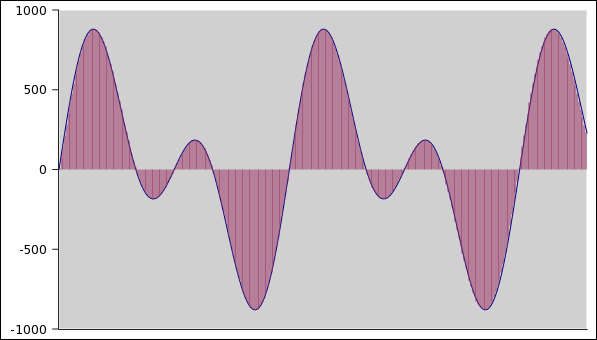
the sound wave. So the wave in this figure
is in fact a stream of numbers like this one
0 72 144 215 285 352 417 479 538
            593 644 690 732 769 801 828 849 865
            875 880 879 873 862 846 825 799 769 736 699 659 616 571 524
            476 426 377
            327 278 229 182 136 92 51 12 -23 -56 -85 -111 -133 -151 -165
            -175 -182
            -184 -184 -179 -171 -161 -147 -131 -113 -92 -71 -48 -24 0 24
            48 71 92
            113 131 147 161 171 179 184 184 182 175 165 151 133 111 85
            56 23 -12
            -51 -92 -136 -182 -229 -278 -327 -377 -426 -476 -524 -571
            -616 -659
            -699 -736 -769 -799 -825 -846 -862 -873 -879 -880 -875 -865
            -849 -828
            -801 -769 -732 -690 -644 -593 -538 -479 -417 -352 -285 -215
            -144 -72 0
            72 144 215 285 352 417 479 538 593 644 690 732 769 801 828
            849 865 875
            880 879 873 862 846 825 799 769 736 699 659 616 571 524 476
            426 377 327
            278 229 182 136 92 51 12 -23 -56 -85 -111 -133 -151 -165
            -175 -182 -184
            -184 -179 -171 -161 -147 -131 -113 -92 -71 -48 -24 0 24 48
            71 92 113
            131 147 161 171 179 184 184 182 175 165 151 133 111 85 56 23
            -12 -51
            -92 -136 -182 -229 -278 -327 -377 -426 -476 -524 -571 -616
            -659 -699
            -736 -769 -799 -825 -846 -862 -873 -879 -880 -875 -865 -849
            -828 -801
            -769 -732 -690 -644 -593 -538 -479 -417 -352 -285 -215 -144
            -72 0 72
            144 215 285 352 417 479 538 593 644 690 732 769 801 828 849
            865 875 880
            879 873 862 846 825 799 769 736 699 659 616 571 524 476 426
            377 327 278
            229 ...
where
each number represent the amplitude of the wave at a
given
instant like a graph with the time on x-axis and the
amplitude on
y-axis.
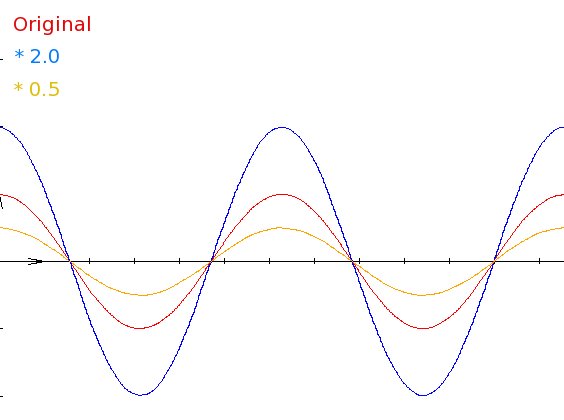
So, to change the wave's amplitude we can simply multiply each
number
for a given value. If that value is greater that 1, the
amplitude
increase. If it is lower that 1, the amplitude decrease. In the
following image, a plotted digital wave (red) is multiplied by
2.0
(blue) and by 0.5
(yellow). Here is the result. You can clearly see that only
amplitude
is
affected.
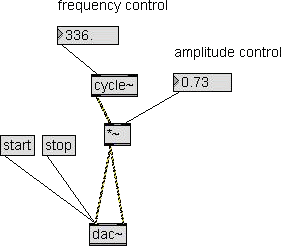 Applying amplitude
control to a signal
To apply amplitude control to a signal we only need a multiplier
between the signal generator(s) and the dac~ (see patch on the
left).
Be sure to pick the MSP multiplier (with tilde: *~) from the MSP
Operators group, not the Max multiplier (with no tilde).
To set the amplitude value we can use a floating point number.
Now we
must set the range of the amplitude control.
In MSP, the maximum amplitude a dac~ can handle is 1, that is,
when
reaching the dac~, a wave must run between ±1 to avoid clipping
and
distortion. Of course a zero amplitude is no signal.
The cycle~ generator already output a wave at maximum amplitude,
so our
amplifier is in fact a damper and will have the range 0 - 1
(here the
reason we must use a floating point number).
If the amplitude control would reach a value greater that 1, a
wave
with range > ±1 would reach the dac~ and be clipped: you
would hear
no amplitude increment, but harmonic distortion (try a value
> 1).
Amplitude evaluation
Measuring the amplitude of an incoming signal could be very
important
when you work with external signals. Now we'll see different
ways to do
it using standard Max/MSP objects.
To make it simple, we'll apply the measurement to the cycle~
sine wave
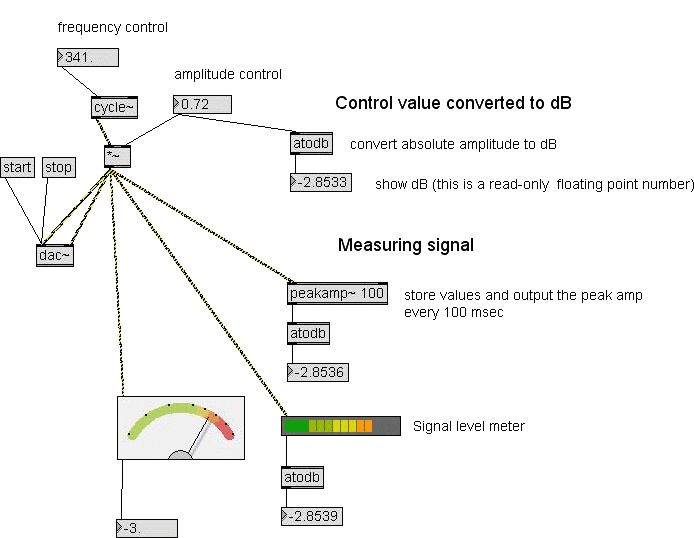
for now. Look at the the patch 03.
Here you can see and try different ways to evaluate a signal's
amplitude.
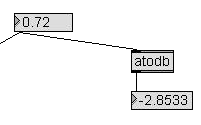
|
This is not a real
measument.
Here we convert the given amplitude value to dB for
control purposes
only and see if the real evaluations match.
By the way, here you can find the atodb object that
convert a number to
deciBels. It is taken from the Max "Math" section on the
object list.
The atodb output is connected to a number object to show
the resulting
dB. The number object is made read-only (check the
option in the
floating inspector).
|
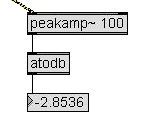
|
Here is the first real
signal
amplitude evaluation.
You can find the peakamp~ object on the "MSP Analysis"
section. This
object accept a signal in its left inlet and output the
maximum
absolute amplitude every k milliseconds, where k is the
argument (100
in figure). You can also control the k value sending an
integer number
to the right inlet.
The peakamp~ object is very accurate and it's a good and
simple way to
evaluate the peak amplitude of a signal.
|

|
In the palette you can
find two
graphic objects to evaluate and show a signal amplitude.
|
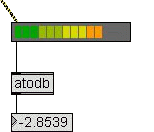
|
The peak level meter
accept a
signal in its left inlet and display the amplitude by
the usual led
line. It also output the evaluated absolute amplitude.
The object appearance can be fully edited using the
floating inspector.
Running the patch you'll see that when the input signal
has a low
frequency (set the frequency control to 50 Hz or lower)
the result is
rapidly changing. This is not a bug. It does not happens
with natural
sounds. Here it happens because:
- The peak level meter has a little buffer. When the
wave
frequency is low it see only a section of the wave
cycle, but, more
important:
- Here we supply a single sine wave without
harmonics. In
nature the signals have harmonics whose frequencies
are higher than the
fundamental, so the wave is more complex and the
peak amplitude can be
evaluated also with a little buffer.
This object's MSP name is meter~. If you to know more
about it search
for meter~ on the MSP Reference manual.
|
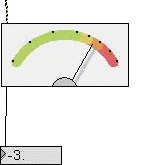
|
This level meter seems
like the
previous one, with needle in place of leds, but it has
some important
differences.
It is not a peak level meter. It computes the RMS
(root-mean-square) of
the signal's amplitude. This is very important because
the peak value
is meaningful with a simple harmonic wave, but it makes
little sense to
talk about a peak
amplitude when describing a complex sound (e.g. a drum
stroke) or a
noise. This is because there are many peak
amplitudes and any one is not representative of the
overall amplitude.
So, how should we measure the amplitude of a complex
signal? We can't
take the average of the instantaneous amplitudes since
negative and
positive
values always cancel yielding an average value of zero.
To prevent
this we square each amplitude making all values
positive. We then take
the
square root of the average of the squared values to get
back to an
amplitude
measure. The resultant measure is referred to as the
root-mean-square
or
RMS
amplitude. The RMS amplitude is a more commonly accepted
measure of
amplitude
because it applies to periodic sounds like sinusoids as
well as to
noise.
This object output the RMS amplitude value in dB, so
there is no need
of the atodb object.
This object's MSP name is levelmeter~. If you to know
more about it
search for levelmeter~ on the MSP Reference manual.
|
Now that you know more about the amplitude, you can set 0 dB on
your
mixer.
If you connect Max/MSP to a professional mixer with measurement
leds on
input and output, you can easily set the 0 dB. On the computer,
play a
test frequency (about 1000 Hz). Then set the
board output to the maximum (or the level you normally use, but
a good
board should work well at the maximum with no distortion). Then
set the
amplitude control of the patch to the maximum (i.e. 1.0). This
is the
MSP 0 dB (you should see 0 dB on all the meters).
On the mixer, set the input slider to 0 dB and turn the input
sensitivity control (if any) until the input signal level show 0
dB. Do
the same for the mixer output.
Why the dac~ maximum amplitude is 1?
It's a good question. Why 1 and not 100 or 1000 or a power of 2,
like
1024 or the real amplitude of the sound board? Is there some
technical
reason to set the range to 0 - 1? The answer lead us to the
realm of
computer arithmetic, so it could be a little complex business.
This
notes are for more
advanced (or curious) users.
- Max/MSP must work with many different sound
boards and the sound boards currently on the market can have
different
dac types, typically 16 or 24 bit. Maximum values are 32767
for 16 bit
(2(16-1) - 1)
and 8388607 for 24 bit (2(24-1) - 1).
But the software can't work with absolute amplitude values
simply
because the patches you make, must work with all the sound
boards, even
if you change machine or the board itself. So a conventional
maximum
amplitude value has to be set. When sending sound data to
the sound
board all values will be scaled according to the maximum
value the
board support.
- MSP works with 32 bit floating point
numbers. This is a very accurate way to make calculations on
a computer
because 32 bit floating point numbers can hold until 18
digits after
the decimal point.
Floating point is more accurate than 24 or 32 bit integer
arithmetic. People
often think that every operations on digital signals are
noiseless, but
with integer arithmetic it's not really true. A very
simple
example: suppose you are working with 24 bit integer
arithmetic on a
digital wave with amplitude 8388607 (the maximum). Now
suppose you are
mixing, and this signal's amplitude is lowered multiplying
by, say, a
0.731 factor. The resulting amplitude is 6132071.717. OK:
where do you
think this 0.717 goes? It get lost because this is integer
arithmetic
and by this way every multiply you make creates a very
little sampling
error.
An experienced digital user can argue that with integer
arithmetic you
never multiply by floating point numbers. You multiply by an
integer
number creating a double precision result that will be
truncated to
simple precision, but it's the same because here are the
lower bits
that get lost.
The meaning of the story is: always try to work with 32 bit
floating
point when making computations on digital signals. You can't
avoid the
final rounding error, when data are sent to the board's dac
or are
written on audio CD in the usual format (44100, 16 bit,
stereo), but at
least you save the accumulation of little sampling errors.
The current
debate is about 48 bit integer versus 32 bit floating
arithmetic (see
this
James A. Moorer's paper), but under the 48 bit integer
arithmetic,
32 bit float is surely better.
- But why 0 - 1? Even with floating point arithmetic, a
conventional amplitude of, say, 1000 could be easiest to
understand.
Because of the problem of floating point arithmetic: while
number
increase, you lose precision after the decimal point. This
is normal
business on real world. If someone owes you $10.95 all the
digits are
significant, but if someone owes you $100000.95 you could
apply a
little
discount and save the $0.95.
So, to hold the maximum accuracy, MSP choose to work with
little
numbers.
A useful patch: Hear the Fletcher/Munson Effect
Important note: to hear the Fletcher/Munson effect you
must work
with hi-fi speakers. This is because this effect is evident at
low
frequencies (under 100 Hz) and the little computer speakers are
not
effective at this frequencies. You can use haedphones but
be
careful.
Never turn on a patch without controlling its loudness or the
volume of
your equipment. Set amplitude/loudness to 0, turn on the patch
and then
raise the volume.
Let's do this trial.
- Return to patch 02 (single cycle~ with frequency and
amplitude
controls).
- Set the frequency at (about) 1000 Hz.
- Be sure to
turn off the loudness control of your amplifier (if any) and
the
equalizer (if any; remember that many mixers have filters).
The
frequency response of your equipment must be flat
(as much as
possible).
- Set the amplitude control to 0 (no sound).
- Turn on the patch and set a suitable amplitude (not
disturbing
but
clearly audible).
Now begins to lower the frequency (click on the left part of the
control box to change the integer part only, going down faster).
Never
change the amplitude. Move down the frequency only.
Under 500 Hz, the loudness will be a little lower. About and
under 100
Hz the loudness will be very low. Very low frequencies (60 Hz
and
lower) will be barely audible
even if the amplitude is the
same!.
Why? It's your speakers? Maybe, but the real answer is that the
human
ear frequency response (or better, the ear\brain combination
response)
is not
the same for whole audible area. The ear works better
approximately from 500 to 5000 Hz. Outside this area it needs
more
amplitude to hear equal loudness.
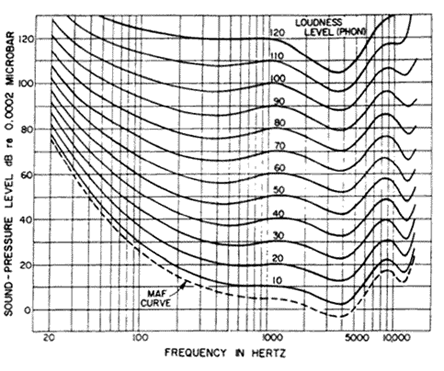
This effect has been first studied
in 1937 by Fletcher
&
Munson who traced the human ear response curves. In 1956
Robinson
& Dadson refined the Fletcher/Munson curves and today the
Robinson/Dadson curves are generally preferred over the
Fletcher/Munson
curves owing to their more reliable measurement results. The
International Standards Organization agreed and adapted the
Robinson/Dadson curves as the basis for ISO 226:1987; Normal
Equal-Loudness
Level Contours (ELLC) (see image on the left; the MAF line is
the
Minimum Audible Field).
This chart say that humans don't hear all frequencies at the
same level. That is, our ears are more sensitive to some
frequencies
and less sensitive to other frequencies. Not only that, but the
sensitivity changes with the sound pressure level (SPL), too.
Take a
look at the chart. You'll notice it's marked horizontally with a
scale
denoting the frequency of sound. Vertically it's marked in SPL.
On the
chart are a number of curved lines, each with a number (loudness
level)
marked.
Let's begin by looking at the lowest solid line marked with a
loudness
level of 10 phons. (The loudness level in phons is a subjective
sensation--this is the level we perceive the sound to be at.)
From
about 500Hz to roughly 1,500Hz the line is flat on the 10dB
scale. This
means that for us to perceive the sound being a loudness level
(LL) of
10 phons, (the overall curved line), frequencies from 500Hz to
1,500 Hz
must be 10dB. Make sense so far? OK, now look further into the
higher
frequencies, say 5,000Hz. Notice the line dips here--this says
we
perceive 5,000Hz to be 10 phons when the source is actually only
6dB.
To perceive 10,000Hz at the same level (10 phons), it would need
to be
about 20dB. From this we can clearly see the ear is more
sensitive in
the 2,000Hz to 5,000Hz range, yet not nearly as sensitive in the
6,000Hz and up range.
Lets take a look down at the lower frequencies now, say 100Hz.
For us
to perceive 100Hz as loud as we do 1,000Hz (when the source is
at
10dB), the 100Hz source must be at 30dB–that's 20dB higher than
the
1,000Hz signal! Looking even farther down, a 20Hz signal must be
nearly
75dB (65dB higher than the 1,000Hz signal)! We can clearly see
our ears
are not very sensitive to the lower frequencies, even more so at
lower
SPL levels.
Why is this? A simply physical explanation is that resonance in
the
ear-canal amplifies frequencies between 1500 Hz and 5000
Hz with a peak around 3000 Hz. In addition, the response in the
range
between 500 and 1500 is flat. All other frequencies are damped.
Note
that the main communication
area lies in the range 500 - 5000. In this range we find human
and
animal voices and in the upper part of this range we find the
children
voices.
Now you know why the double-bass sound box is so big. Looking at
the
musical instruments construction, we can see many ways to
compensate
the Fletcher/Munson effect. For instance, the mechanical device
of
piano lower keys is adjusted to struck the string a little
harder with
respect to medium and high registers. So the player can achieve
about
the same loudness using the same force.
OK. We heard the Fletcher/Munson effect and we also know what is
and
why it happens. But now we can also measure it. Load the
fletcher patch.
Here you can see two versions of the Fletcher patch. Now look at
the
simplest and not hidden (left). There is a reference frequency
fixed at
1000 Hz on right channel and a second cycle~ that can be set to
various
frequencies (8ve distance) on the left channel.
To measure the Fletcher/Munson effect you must choose a
frequency on
the left, then move the amplitude control of the 1000 Hz (up on
the
right), until you hear the two frequencies have equal loudness.
Then
you read the amplitude difference in dB in the read-only number
box
down on the right.
The atodb object convert the amplitude from absolute value to dB
value.
This value is negative because it say how much the 1000 Hz must
be
damped to hear equal loudness.
The second patch version is the same with a more pleasant user
interface, but two main differences:
- it uses a slider as amplitude control: note that the
slider range
is 0-100 (set by the floating inspector); then is multiplied
by 0.01 to
achieve the 0-1 range. This is because the slider object
can't output
floating point numbers (integers only). This kind of number
trick is
common on Max. We'll see more on the next lesson.
- the converted dB value is multiplied by -1 to see a
positive
number.
 Numbers as
Sliders
 Numbers as
Sliders
 The Floating Inspector
 Applying amplitude
control to a signal


 This effect has been first studied
in 1937 by Fletcher
&
Munson who traced the human ear response curves. In 1956
Robinson
& Dadson refined the Fletcher/Munson curves and today the
Robinson/Dadson curves are generally preferred over the
Fletcher/Munson
curves owing to their more reliable measurement results. The
International Standards Organization agreed and adapted the
Robinson/Dadson curves as the basis for ISO 226:1987; Normal
Equal-Loudness
Level Contours (ELLC) (see image on the left; the MAF line is
the
Minimum Audible Field).